Consolidated Results Trend
|
2021/05 |
2022/05 |
2023/05 |
2024/05 |
2025/05 |
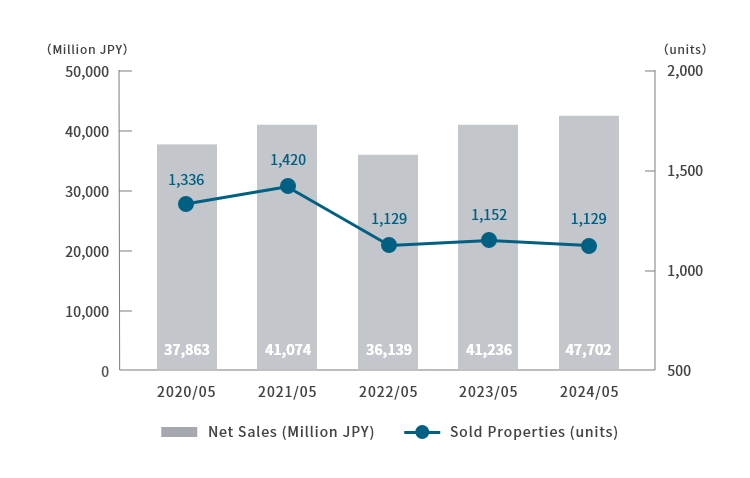
| Net Sales (Million JPY) |
41,074 |
36,139 |
41,236 |
42,702 |
44,793 |
| Sold Properties (units) |
1,420 |
1,129 |
1,152 |
1,129 |
1,052 |
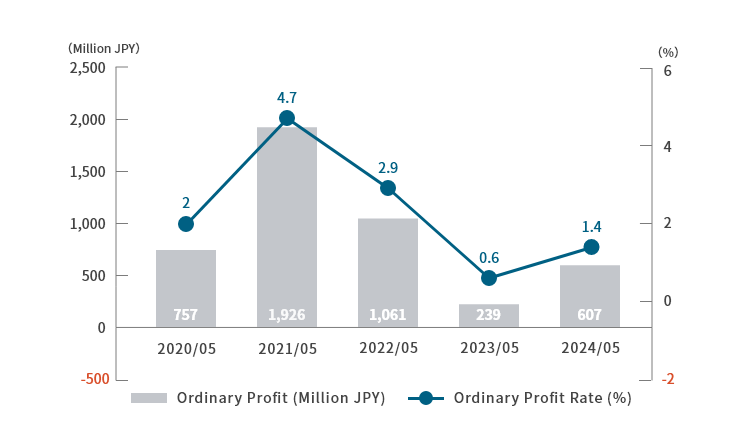
| Ordinary Profit (Million JPY) |
1,926 |
1,061 |
239 |
607 |
2,166 |
| Ordinary Profit Rate (%) |
4.7 |
2.9 |
0.6 |
1.4 |
4.8 |
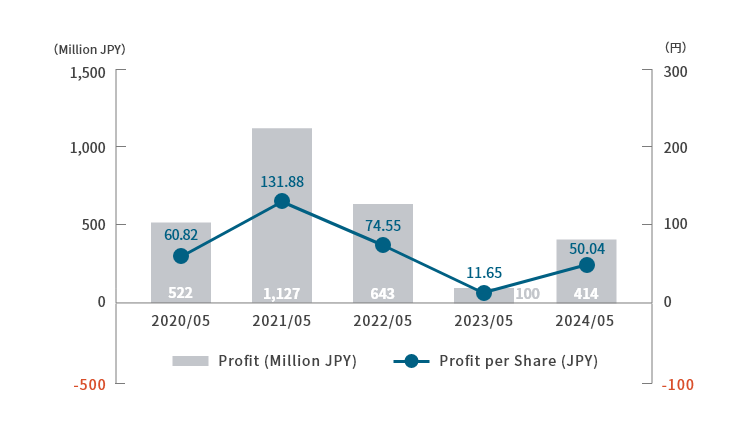
| Profit (Million JPY) |
1,127 |
643 |
100 |
414 |
1,667 |
| Earnings per Share (JPY) |
131.88 |
74.55 |
11.65 |
50.04 |
206.54 |
Number of Renovated Condominiums Sold
Net Sales/ Number of Renovated Condominiums Sold

Ordinary Profit/ Ordinary Profit rate

Profit/ Earnings per Share

Consolidated Financial Data
|
2021/05 |
2022/05 |
2023/05 |
2024/05 |
2025/05 |
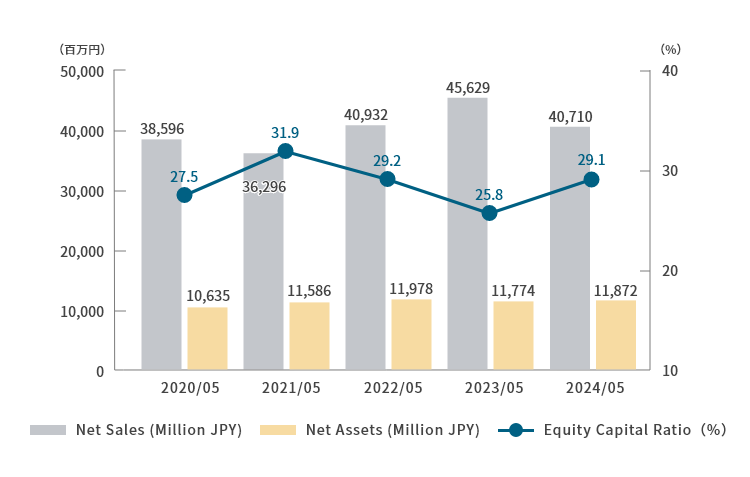
| Total Assets (Million JPY) |
36,296 |
40,932 |
45,629 |
40,710 |
52,663 |
| Net Assets (Million JPY) |
11,586 |
11,978 |
11,774 |
11,872 |
13,621 |
| Equity Capital Ratio |
31.9 |
29.2 |
25.8 |
29.1 |
25.4 |
| Net Assets per Share (JPY) |
1,351.77 |
1,381.47 |
1,403.89 |
1,479.04 |
1,650.38 |
Total Assets/ Net Assets/ Shareholder's Equity Ratio

Consolidated cash flow
|
2021/05 |
2022/05 |
2023/05 |
2024/05 |
2025/05 |
| Cash Flow from Operating Activities |
10,153 |
-3,896 |
-930 |
8,861 |
-5,931 |
| Cash Flow from Investment Activities |
-4,481 |
-3,183 |
-2,851 |
-3,116 |
-2,899 |
| Cash Flow from Financing Activities |
-4,381 |
5,300 |
4,313 |
-5,788 |
9,385 |
| Ending balance of cash and cash equivalents |
5,982 |
4,203 |
4,734 |
4,690 |
5,243 |
Other
Employees
|
2021/05 |
2022/05 |
2023/05 |
2024/05 |
2025/05 |
| Consolidated |
325 |
327 |
342 |
319 |
311 |
| Non-Consolidated |
234 |
224 |
232 |
213 |
195 |


